Rung one
CRYPTOCAP:TOTALES, daily
Confirmed Close MTPI TOTALES
Is the crypto market as a whole trending up or down?
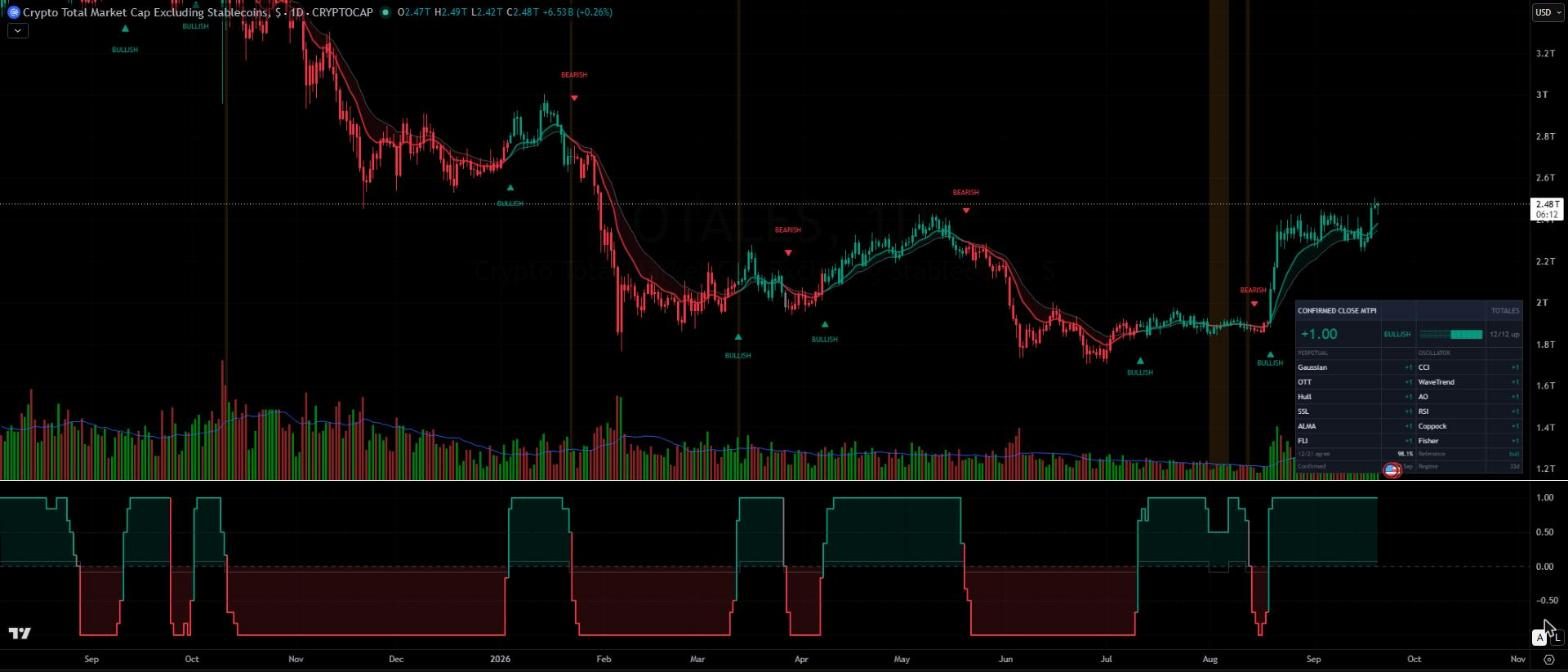
A positive score means: the total value of the crypto market, stablecoins excluded, is in an uptrend.
uptrenddowntrend
Every rung of the ladder has its own indicator on TradingView. Each one runs twelve separate measurements on a daily chart, turns them into a single number between minus one and plus one, and refuses to change its mind until the candle has closed. All five are published, free, and readable line by line.
The method came out of a portfolio course, and the way it is normally taught is a spreadsheet. You open a chart, add a dozen indicators, look at each one, type up or down into a cell, and read the average at the bottom. Do that for five markets and it is most of an hour, every single day, and every one of those readings is a chance to type the wrong thing or to talk yourself into a vote you wanted rather than the one on screen.
These scripts are that spreadsheet moved onto the chart. Same twelve measurements, same settings, same arithmetic, except the chart does the reading and the typing. The number in the corner of the chart is the number that would have gone into the cell. Nothing is optimised, nothing is predicted, and no part of it can be nudged by how the day feels.
They are published for two reasons. A system nobody can inspect is a system nobody should trust, and a claim about a rule is worth very little next to the rule itself. Everything the ladder does to decide where money sits is now something you can put on your own chart and check against your own data.
An indicator is a small calculation that looks at recent prices and says something about them. Some of them follow the trend itself, the way a moving average does, and answer the question is price above its own recent average or below it. Others measure momentum, which is whether a move is still picking up speed or quietly running out of it. Each kind is useful and each kind is regularly wrong, in its own particular way.
So none of them gets to decide on its own. Twelve of them look at the same daily chart. Six follow the trend, six measure momentum. Each one casts a single vote, up or down, with no half votes and no weighting. The twelve votes are averaged and that average is the score.
Because twelve whole votes are averaged, the score can only land on thirteen values, one sixth apart. That makes it easy to read backwards. +0.67 means ten agreed and two did not. +0.17 is the weakest possible yes, seven against five. The size of the number tells you how united the panel is, which is worth knowing, but only the sign changes what the system does.
A panel of twelve is not more accurate than a good single indicator. It is less volatile. One indicator flips on a single noisy day and takes your whole position with it. Twelve of them have to be talked round one at a time, so the score slides through the middle values before it crosses zero. That slowness is the feature. It is also the reason the system is late at every turn, which is covered honestly further down.
A daily candle is not finished until the day is over. Until then its close keeps moving, so anything calculated from that close keeps moving too. An indicator that reads from the unfinished candle will happily show you a buy signal at lunchtime and have erased it by midnight, leaving no trace that it was ever there. That erasing is called repainting, and it is the single most common way a backtest flatters an indicator that never worked.
These scripts do not read from the unfinished candle at all. While today is still running they show yesterday's confirmed reading and nothing else. The score can only change at the moment a daily candle closes, which for crypto and gold is 00:00 UTC. What you see on the chart at any moment is a decision that was already final before you looked at it.
The practical rule falls straight out of that. A flip belongs to the close that produced it, and the earliest honest place to act on it is the open of the next candle. Acting before then means acting on a number that can still change, which is not a system, it is a guess with extra steps. The timing page goes through what that looks like in practice.
Adding the script puts four things on your chart. The candles change colour with the score. A triangle with a word beside it marks each flip. A pane underneath draws the score itself as a stepped line between minus one and plus one, filled to the zero line. And a small table sits in the corner with the full breakdown.
There is also a pair of plain moving averages on the chart, the 12 and the 21. They are not part of the vote and they never touch the score. They are there as a sanity check, because the settings were tuned against that cross in the first place, and the table reports how often the two agree.
The shaded vertical bands you will see on the charts below are the days when the panel and that simple cross disagreed. They are worth looking at, because they are the days the extra eleven indicators actually earned their place, for better or worse.
They share a layout and a method and nothing else. Each is tuned for its own market, which means the twelve components differ and the settings differ. Putting the gold one on a crypto chart will produce a number, and that number will be meaningless.
Each has its own colour pair so that five charts stay apart at a glance. Where the question is which of two things is winning, the colours name the two things rather than saying bullish or bearish, because there is no such thing as a bullish ratio.
Is the crypto market as a whole trending up or down?
A positive score means: the total value of the crypto market, stablecoins excluded, is in an uptrend.
When crypto is trending up, which of the two majors is leading?
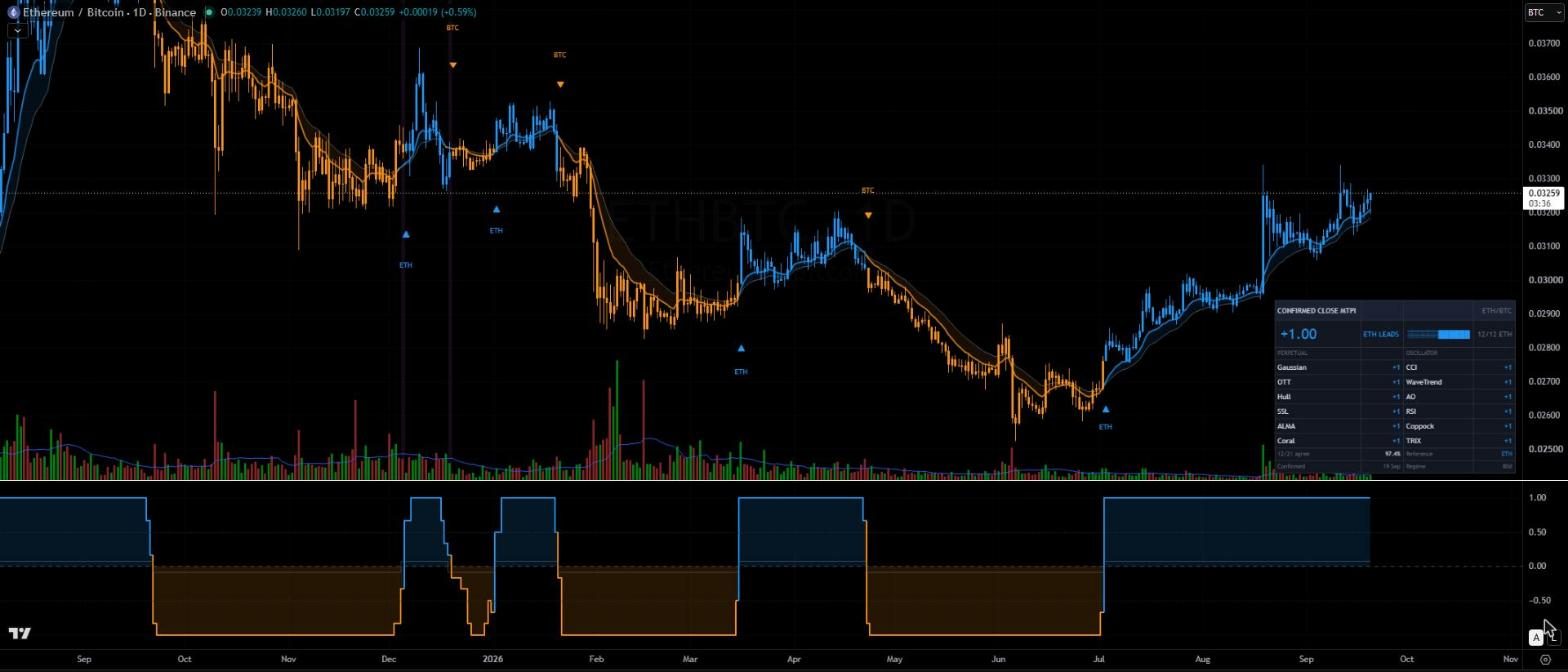
A positive score means: ether is beating bitcoin. Both can still be falling in dollars, this only measures one against the other.
When crypto is trending down, is gold trending up?
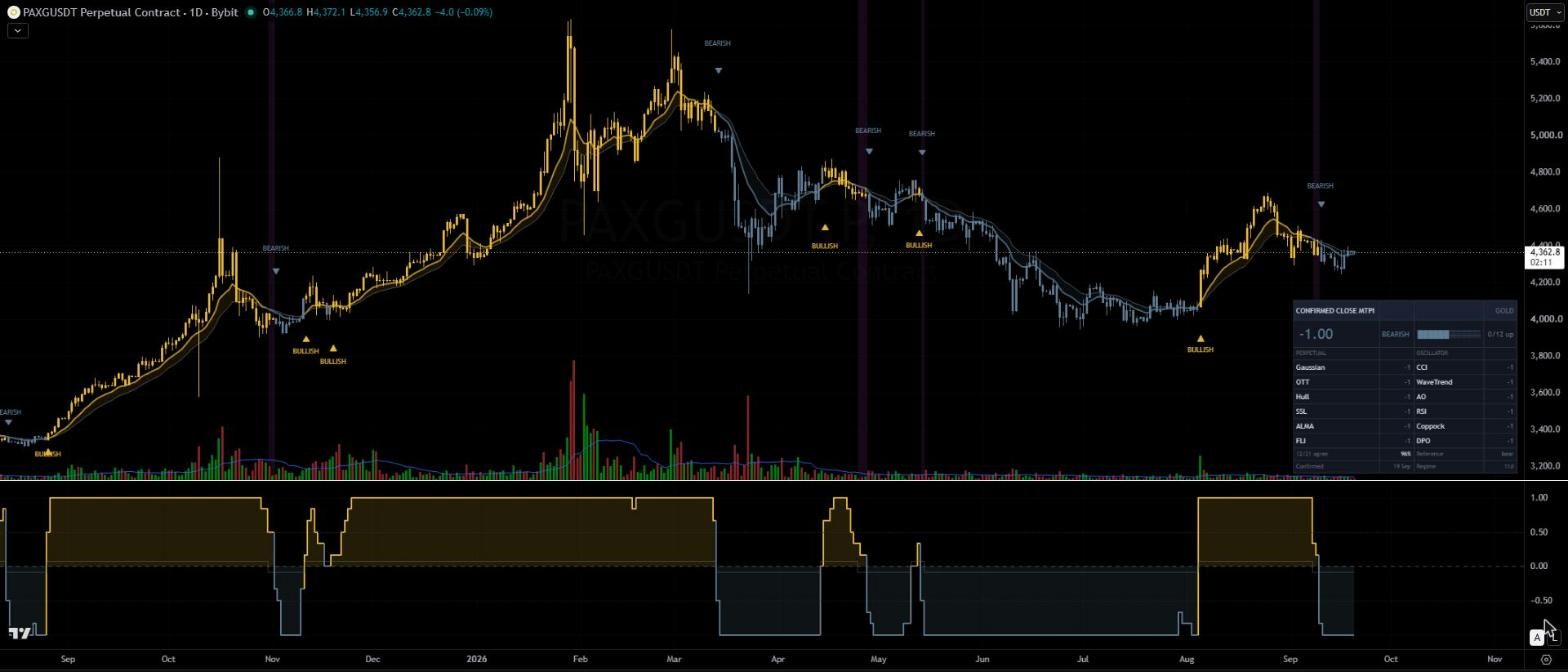
A positive score means: gold is in an uptrend and is worth holding while crypto is not.
When gold is not trending either, are equities?
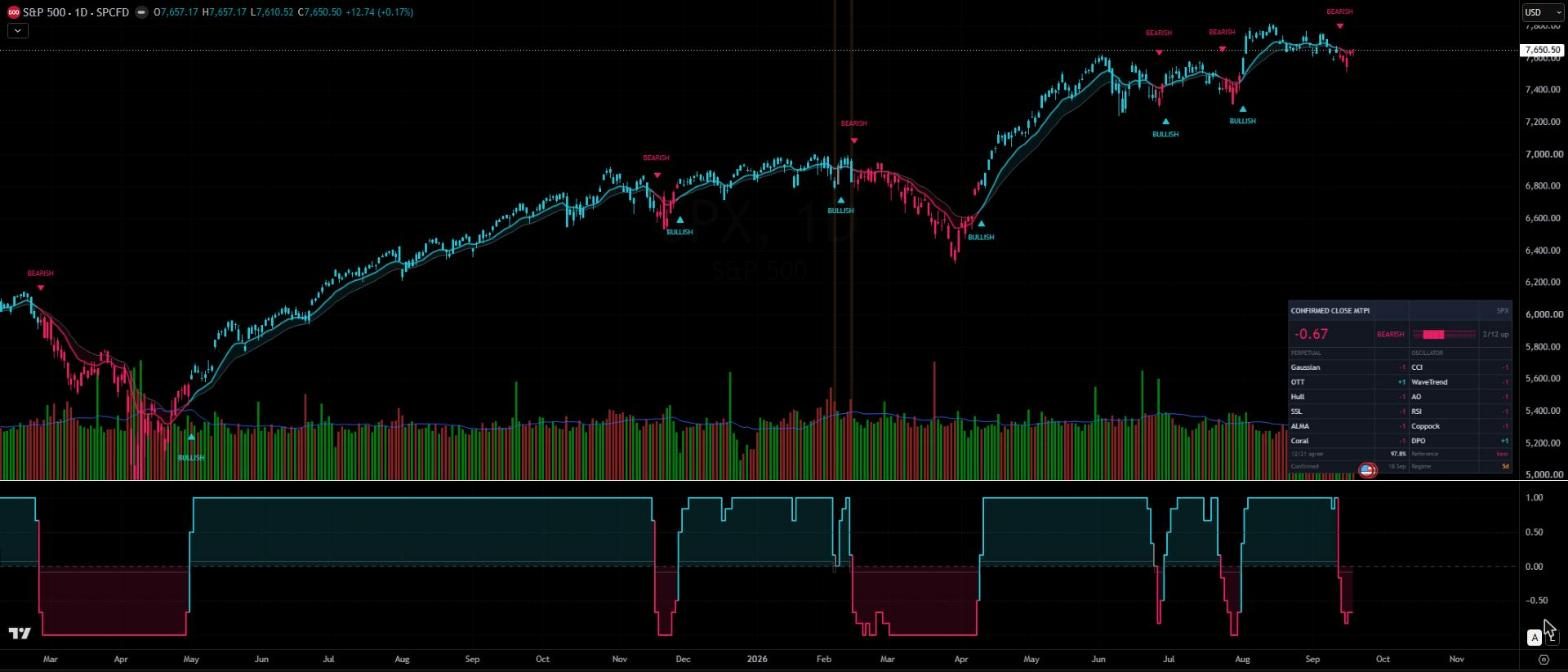
A positive score means: the S and P 500 is in an uptrend.
When nothing is trending, which currency should the cash sit in?
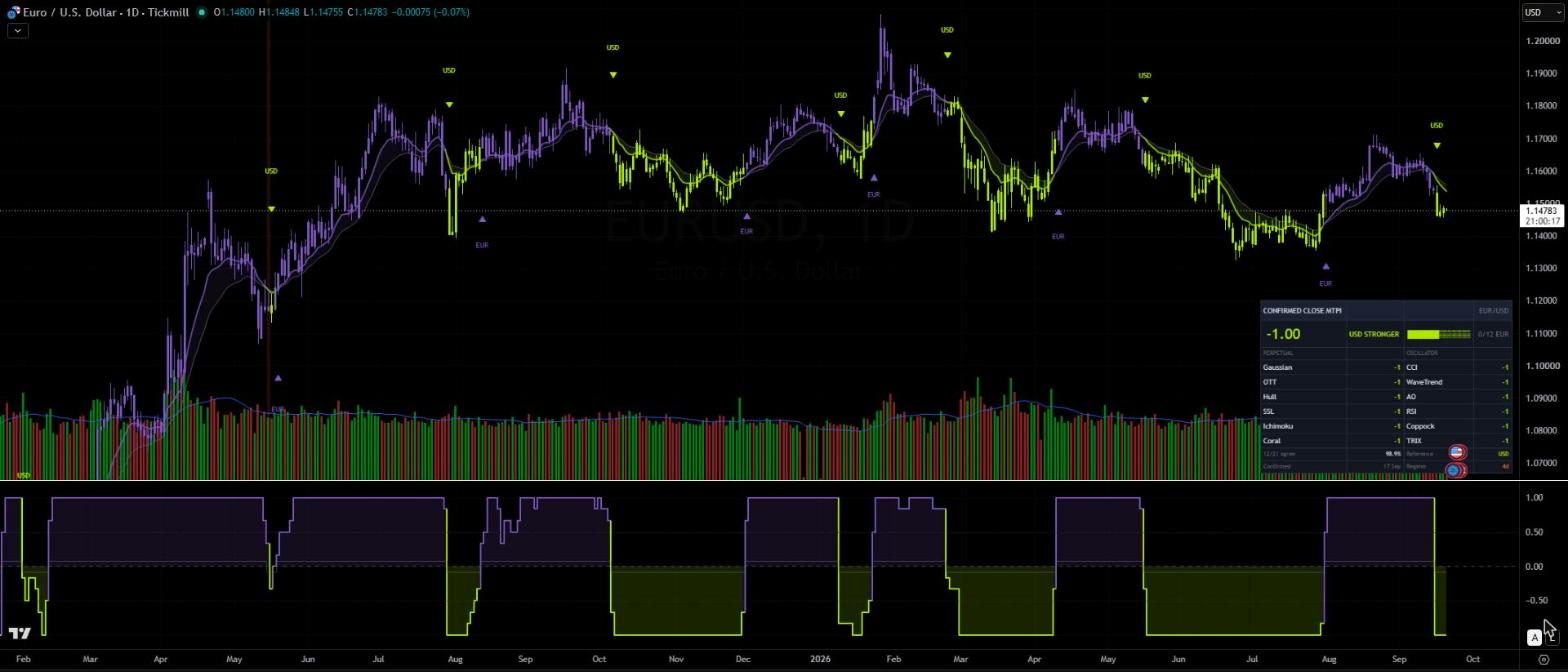
A positive score means: the euro is the stronger of the two, so cash sits in euro rather than dollar.
All five sit on the same TradingView profile. They are free and open source. You can read every line, copy it, change it, and check any claim on this page against your own chart.
Nine of the twelve appear in every market. Two slots swap, one in the trend six and one in the momentum six, because some measurements simply do not behave on some series, and the euro pair swaps a third. The numbers below are read straight out of the published source, not from memory.
One setting looks like a mistake and is not. The Optimized Trend Tracker runs on a weighted moving average for the crypto market and on an exponential one everywhere else, and on the euro pair the Coppock Curve is configured upside down compared with the textbook. Both are what the tuned system actually uses, and both are published as they are rather than tidied up.
| Component | What it is | Settings |
|---|---|---|
| Gaussian Channel [DW] | trend | hlc3, poles 2, sampling 79, TR mult 1.414 |
| Optimized Trend Tracker | trend | close, period 37, percent 0.7, WMA |
| Hull Suite by InSilico | trend | close, Ehma, length 70, multiplier 1 |
| SSL Channel | trend | period 39 |
| Arnaud Legoux Moving Average | trend | length 69, offset 0.85, sigma 6 |
| Follow Line Indicator | trend | BB period 33, deviation 1, ATR filter off |
| Commodity Channel Index | momentum | length 40, hlc3, EMA 5 |
| WaveTrend [LazyBear] | momentum | channel 26, average 10 |
| Awesome Oscillator v2 KIVANC | momentum | fast 5, slow 43, signal 7 |
| Relative Strength Index | momentum | length 13, close, EMA 9 |
| Coppock Curve | momentum | WMA 7, long RoC 35, short RoC 16 |
| Fisher Transform | momentum | length 35 |
CRYPTOCAP:TOTALES, daily.
| Component | What it is | Settings |
|---|---|---|
| Gaussian Channel [DW] | trend | hlc3, poles 2, sampling 78, TR mult 1.414 |
| Optimized Trend Tracker | trend | close, period 30, percent 0.7, EMA |
| Hull Suite by InSilico | trend | close, Ehma, length 72, multiplier 1 |
| SSL Channel | trend | period 47 |
| Arnaud Legoux Moving Average | trend | length 98, offset 0.95, sigma 6 |
| Coral Trend Indicator [LazyBear] | trend | smoothing 24, constant D 0.2 |
| Commodity Channel Index | momentum | length 43, hlc3, EMA 5 |
| WaveTrend [LazyBear] | momentum | channel 27, average 11 |
| Awesome Oscillator v2 KIVANC | momentum | fast 3, slow 47, signal 7 |
| Relative Strength Index | momentum | length 13, close, EMA 12 |
| Coppock Curve | momentum | WMA 6, long RoC 36, short RoC 16 |
| TRIX | momentum | length 10 |
BINANCE:ETHBTC, daily. Coral Trend takes the Follow Line slot and TRIX takes the Fisher slot.
| Component | What it is | Settings |
|---|---|---|
| Gaussian Channel [DW] | trend | hlc3, poles 2, sampling 88, TR mult 1.414 |
| Optimized Trend Tracker | trend | close, period 37, percent 0.2, EMA |
| Hull Suite by InSilico | trend | close, Ehma, length 82, multiplier 1 |
| SSL Channel | trend | period 40 |
| Arnaud Legoux Moving Average | trend | length 70, offset 0.85, sigma 6 |
| Follow Line Indicator | trend | BB period 33, deviation 1, ATR filter off |
| Commodity Channel Index | momentum | length 33, hlc3, EMA 7 |
| WaveTrend [LazyBear] | momentum | channel 27, average 10 |
| Awesome Oscillator v2 KIVANC | momentum | fast 4, slow 39, signal 7 |
| Relative Strength Index | momentum | length 15, close, EMA 9 |
| Coppock Curve | momentum | WMA 5, long RoC 30, short RoC 18 |
| Detrended Price Oscillator | momentum | length 25, centred false |
BYBIT:PAXGUSDT.P, daily. The Detrended Price Oscillator takes the Fisher slot.
| Component | What it is | Settings |
|---|---|---|
| Gaussian Channel [DW] | trend | hlc3, poles 2, sampling 79, TR mult 1.414 |
| Optimized Trend Tracker | trend | close, period 33, percent 0.4, EMA |
| Hull Suite by InSilico | trend | close, Ehma, length 77, multiplier 1 |
| SSL Channel | trend | period 45 |
| Arnaud Legoux Moving Average | trend | length 72, offset 0.85, sigma 6 |
| Coral Trend Indicator [LazyBear] | trend | smoothing 22, constant D 0.1 |
| Commodity Channel Index | momentum | length 38, hlc3, EMA 5 |
| WaveTrend [LazyBear] | momentum | channel 25, average 11 |
| Awesome Oscillator v2 KIVANC | momentum | fast 4, slow 41, signal 7 |
| Relative Strength Index | momentum | length 13, close, EMA 10 |
| Coppock Curve | momentum | WMA 5, long RoC 30, short RoC 18 |
| Detrended Price Oscillator | momentum | length 26, centred false |
SPCFD:SPX, daily. Coral Trend and the Detrended Price Oscillator take the two swap slots.
| Component | What it is | Settings |
|---|---|---|
| Gaussian Channel [DW] | trend | hlc3, poles 2, sampling 76, TR mult 1.414 |
| Optimized Trend Tracker | trend | close, period 32, percent 0.15, EMA |
| Hull Suite by InSilico | trend | close, Ehma, length 72, multiplier 1 |
| SSL Channel | trend | period 39 |
| Ichimoku Cloud | trend | conversion 3, base 42, span B 52, displacement 26 |
| Coral Trend Indicator [LazyBear] | trend | smoothing 23, constant D 0.2 |
| Commodity Channel Index | momentum | length 37, hlc3, EMA 5 |
| WaveTrend [LazyBear] | momentum | channel 26, average 10 |
| Awesome Oscillator v2 KIVANC | momentum | fast 3, slow 39, signal 7 |
| Relative Strength Index | momentum | length 14, close, EMA 9 |
| Coppock Curve | momentum | WMA 30, long RoC 7, short RoC 6 |
| TRIX | momentum | length 10 |
TICKMILL:EURUSD, daily. Only the conversion and base lines of the Ichimoku are used, so the cloud and the lagging span play no part in the vote.
The settings were tuned against a cleaned 12 and 21 EMA cross. Any indicator built from a 12 and 21 pair will therefore agree with that reference almost perfectly, and will look like the best component in the panel while adding nothing at all. That is circularity, not skill, so the whole family is excluded rather than allowed in on a flattering score.
Seven of the twelve components are rewritten from published open source formulas rather than called in, because a Pine script cannot read another script's output. A rewrite that is subtly wrong is worse than useless, so each one was tested rather than trusted.
First check, against the originals. The script and the twelve real indicators were put on one chart and compared vote by vote across every bar the feed would load. Not the final score, each of the twelve individually.
Second check, against the live record. The score was compared against the daily history the system has actually been run on, which is kept as a row per day and never edited after the fact.
| Market | Bars compared | History back to | Disagreements | Against the record |
|---|---|---|---|---|
| Crypto market cap | full loaded history | not recorded | 0 | 626 of 626 days |
| ETH against BTC | 3,298 | 2017-09-08 | 0 | 626 of 626 days |
| Gold | 1,559 | 2022-03-15 | 0 | 626 of 626 days |
| S and P 500 | 5,365 | 2005-05-23 | 0 | 20 of 20 days |
| Euro against dollar | 6,299 | 2002-06-23 | 0 | 625 of 626 days |
Bars compared counts only the bars where all twelve original indicators were reporting, since none of them produce a value until their own lookback has filled.
Two of those rows deserve to be read rather than skipped. The S and P 500 column has only twenty days of live record behind it, because that rung was added to the ladder recently, and twenty days is a weak check next to six hundred. The euro pair has one day out of six hundred and twenty six that does not match, and the cause is known: euro dollar candles close at 21:00 UTC rather than midnight, so a reading taken earlier in the evening records the previous session. It costs at most a day of lag, on the last rung, which the ladder only ever reaches when everything above it is already negative.
There is one caveat inside the dashboard itself. The agreement percentage is measured against the raw 12 and 21 cross, while the tuning used a cleaned version of that cross with every regime shorter than eight days merged away as noise. So the figure on screen is a little lower than the one the tuning was scored on. It is reported that way on purpose rather than quietly improved.
Each script carries two alerts, one for a turn up and one for a turn down. Right click the chart, choose Add alert, pick the indicator as the condition and then the direction you want. Set the trigger to Once per bar close. Anything else will fire you out of bed for a number that has not finished forming.
An alert is not an instruction to trade immediately. It tells you a close has flipped a rung. The trade belongs on the next open.
Nothing in the twelve was invented here. The components are either textbook indicators or open source community scripts, reimplemented so that one script can read all of them at once. The authors of the community ones are named in every publication and are worth following in their own right.
| Component | Author | Used on |
|---|---|---|
| Gaussian Channel | DonovanWall | all five |
| Optimized Trend Tracker | KivancOzbilgic | all five |
| Awesome Oscillator v2 | KivancOzbilgic | all five |
| Hull Suite | InSilico | all five |
| SSL Channel | ErwinBeckers | all five |
| WaveTrend | LazyBear | all five |
| Coral Trend Indicator | LazyBear | ETH/BTC, SPX, EUR/USD |
| Follow Line Indicator | Dreadblitz | TOTALES, GOLD |
The remaining components are standard and need no attribution: ALMA, CCI, RSI, Coppock Curve, Fisher Transform, TRIX, the Detrended Price Oscillator and the Ichimoku conversion and base lines.
What is original is the small part: putting twelve of them behind one number, holding that number until the candle closes, showing the breakdown, and wiring five of these into a ladder that decides where the money sits.
They are always late. A trend has to break before twelve indicators notice, so every exit is below the high and every entry is above the low. That is not a flaw waiting to be tuned out. It is what you pay for only acting on finished information.
They get chopped up sideways. In a market that goes nowhere for months the panel flips back and forth, selling and buying back a few percent higher. The regime counter in the corner is the warning light for this: a string of short regimes means the tool is not working on that market right now.
A daily close cannot save you from a gap. An index or a currency can open several percent below where it closed, and no daily indicator has anything to say about that. The crypto rungs run around the clock so they suffer less from this, and they make up for it by moving further.
Past behaviour proves nothing. Every check on this page is a check that the code computes what it says it computes. It is not evidence that the method will make money. Those are different claims and only the first one has been demonstrated.
These are tools for reading a chart. They do not know your situation, your tax position or how much you can afford to lose, and they will keep producing a number long after it has stopped being useful. What you do with the reading is your decision and your risk.